library(tidyplots)
# Get current year
current_year <- format(Sys.Date(), "%Y") |>
as.numeric()
# Stages
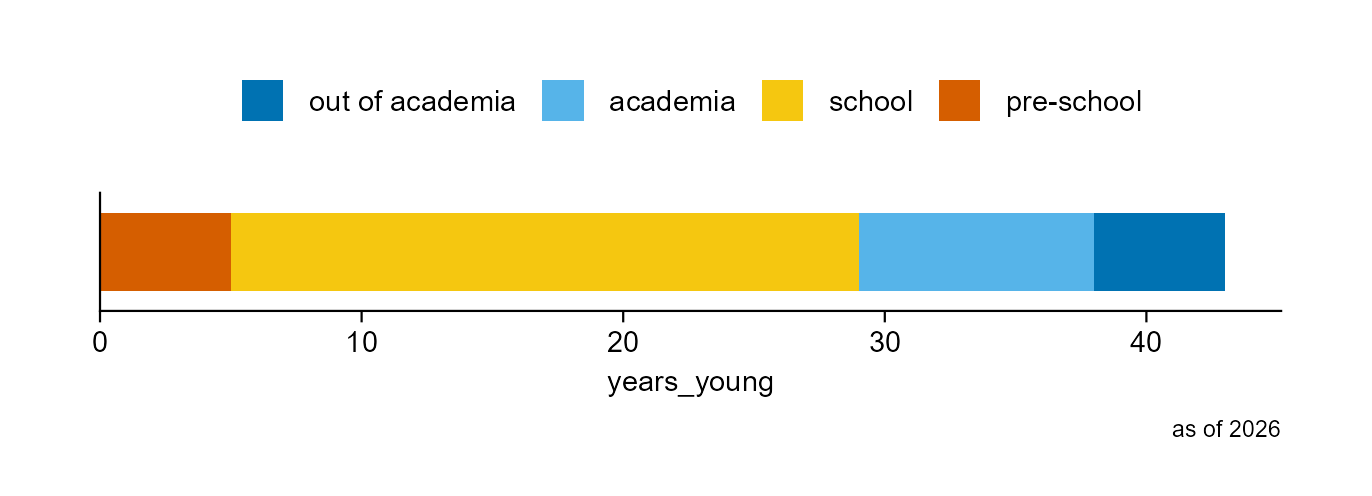
tag <- c("pre-school", "school", "academia", "out of academia")
years_young = c(5, 24, 9, current_year - 2021)
# A data frame
df <- tibble::tibble(
years_young = years_young,
tag = factor(
x = tag,
level = tag))
# Plot
df |>
tidyplot(
x = years_young,
color = tag) |>
add_barstack_absolute(reverse = TRUE) |>
add_caption(caption = paste("as of", current_year)) |>
adjust_size(
width = 100,
height = 10) |>
adjust_legend_position(position = "top") |>
remove_legend_title() |>
remove_y_axis_title() |>
remove_y_axis_ticks() |>
remove_y_axis_line() |>
save_plot(
filename = "images/wk_barstack-absolute.png",
view_plot = FALSE)